There is a close connection between price and volume and it is important for every day trader to understand at least the basics of this relation.
Generally speaking, increasing volume indicates a trend continuation and decreasing volume indicates the end of a trend or a reversal. You need to be familiar with this when you are day trading.
Lets have a look at some more detailed scenarios as day traders:
1. A price advance with steady increasing volume
This indicates continuing upward momentum. As the price is climbing, more and more buyers are getting attracted until the stock gets into a stage of euphoria that usually indicates the end of the price advance.
This indicates continuing upward momentum. As the price is climbing, more and more buyers are getting attracted until the stock gets into a stage of euphoria that usually indicates the end of the price advance.
2. A slowing pace of buying with decreasing volume
This indicates that the top is near. This is also referred to as buying which is drying up. It has two possible outcomes:
This indicates that the top is near. This is also referred to as buying which is drying up. It has two possible outcomes:
- Sellers realize that the top might be near and start selling, causing the stock to reverse lower.
- The stocks starts consolidating and gets supported by strong bids, which indicates that a move higher is likely later.
3. A relatively big volume increase during the price advance with lower volume on the pullback
This indicates a continuing uptrend. The lower volume during the pullback indicates that there are not enough sellers in the market to drive the stock down.
This indicates a continuing uptrend. The lower volume during the pullback indicates that there are not enough sellers in the market to drive the stock down.
4. Big buying volume without the price going higher
This indicates distribution, which means resistance. A big seller is likely in the market. There is no way to tell yet if the buyers will win this battle and are able to drive the price higher, or if they will give up and the stock eventually reverses.
This indicates distribution, which means resistance. A big seller is likely in the market. There is no way to tell yet if the buyers will win this battle and are able to drive the price higher, or if they will give up and the stock eventually reverses.
5. A slow and steady movement upward with consistent volume
This indicates continuing upward momentum. There might be a buyer in the market who is steadily buying shares while trying to not attract too much attention.
This indicates continuing upward momentum. There might be a buyer in the market who is steadily buying shares while trying to not attract too much attention.
6. An extreme acceleration in the price advancing (an almost vertical movement) is usually not sustained
This indicates the end of this stage of the move (euphoric stage). This is a very common scenario. The best example is the Nasdaq market itself in the beginning of 2000; you all know what happened. Those stages of euphoria are very important exit signals for me. They can also present very interesting entry points especially after a stock had a panic sell off.
One of the ways in which we can find constructive price patterns is by identifying those in which volume rises on rallies or falls or declines. This shows the proper type of action for a strong stock as volume dries up when the buyers leave the table. What this is in statistical terms is correlation. I hope these few notes will spur you on to perhaps create indicators, stock rankings, and base analysis statistics as an aid to identifying better stocks.
The theory is that when price and volume move together, the stock is "acting" correctly. Therefore, the higher the correlation, the better acting the stock is. If the correlation was strongly negative, we may see a constructive short forming. Based on this, let's look at the movement of volume and price for a baseline stock like Microsoft (MSFT).
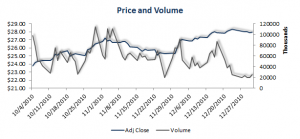
What we would like to see is that large increases in price correspond to large increases in volume, and vice versa. This would show us that price is being backed up by volume. A statistical way of saying that two series are moving together is correlation. Correlation is bound by 1 and -1, with 1 being a perfect positive correlation and -1 being a perfect negative correlation. An example of a high correlation series is the correlation between rainy days and days with clouds in the sky. An example of high negative correlation would be the correlation between rainy days and the days the pavement stays dry outside.
One thing must be noted though, correlation does not equal causation. Just because price and volume may be highly correlated does not mean that volume is the reason for the price moves. It may be earnings, news, etc. Correlation is calculated as the covariance of two series divided by the product of their standard deviation.
This indicates the end of this stage of the move (euphoric stage). This is a very common scenario. The best example is the Nasdaq market itself in the beginning of 2000; you all know what happened. Those stages of euphoria are very important exit signals for me. They can also present very interesting entry points especially after a stock had a panic sell off.
One of the ways in which we can find constructive price patterns is by identifying those in which volume rises on rallies or falls or declines. This shows the proper type of action for a strong stock as volume dries up when the buyers leave the table. What this is in statistical terms is correlation. I hope these few notes will spur you on to perhaps create indicators, stock rankings, and base analysis statistics as an aid to identifying better stocks.
The theory is that when price and volume move together, the stock is "acting" correctly. Therefore, the higher the correlation, the better acting the stock is. If the correlation was strongly negative, we may see a constructive short forming. Based on this, let's look at the movement of volume and price for a baseline stock like Microsoft (MSFT).
What we would like to see is that large increases in price correspond to large increases in volume, and vice versa. This would show us that price is being backed up by volume. A statistical way of saying that two series are moving together is correlation. Correlation is bound by 1 and -1, with 1 being a perfect positive correlation and -1 being a perfect negative correlation. An example of a high correlation series is the correlation between rainy days and days with clouds in the sky. An example of high negative correlation would be the correlation between rainy days and the days the pavement stays dry outside.
One thing must be noted though, correlation does not equal causation. Just because price and volume may be highly correlated does not mean that volume is the reason for the price moves. It may be earnings, news, etc. Correlation is calculated as the covariance of two series divided by the product of their standard deviation.
No comments:
Post a Comment